New Relic vs Prometheus
March 15, 2025 | Author: Michael Stromann
20★
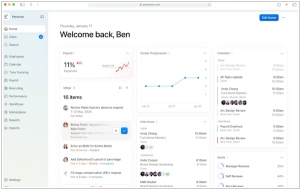
New Relic gets you immediate code-level visibility to build faster software, create better products, and delight your customers. New Relic gets you immediate code-level visibility to build faster software, create better products, and delight your customers.
25★
An open-source monitoring system with a dimensional data model, flexible query language, efficient time series database and modern alerting approach.
See also:
Top 10 IT Monitoring software
Top 10 IT Monitoring software
Imagine, if you will, two monitoring systems—New Relic and Prometheus—both of which are very much concerned with the delicate art of watching over software systems as they chug along in the vast and chaotic universe of cloud-native environments. They both collect metrics, send out alarming signals when things are amiss and provide dashboards for those brave enough to peer into the abyss of data. But no one should be fooled into thinking they're the same; no, they each have their quirks, their distinctive flavors and their own take on monitoring.
New Relic, which first appeared in 2008 like a perfectly-timed comet from the United States, decided that simplicity was the way forward. It’s a fully managed service, offering a polished, user-friendly experience where applications practically monitor themselves. New Relic delivers Application Performance Monitoring (APM) right out of the box, so you can sit back and relax while it tells you everything you need to know about how your app is doing. Real-time reports and performance analytics come standard, just in case you’re feeling a bit too calm about your system's well-being.
Then there’s Prometheus, born in the rather more pragmatic year of 2012 in the land of sausages and precision engineering—Germany. A true open-source champion, Prometheus prefers to let you build your own monitoring empire, giving you the power to manage everything yourself. It excels in environments dominated by containers and microservices, but it’s not as polished or automatic as New Relic. Rather, it’s more like a Swiss army knife for time-series data, requiring a bit more elbow grease and the occasional partnership with Grafana for visualization. But if you're into custom metrics and the idea of controlling your destiny, Prometheus is the intergalactic tool you’ve been searching for.
See also: Top 10 IT Monitoring software


